Heat Map
A heat map is an analytical representation form used to visualize data. In online marketing, heat maps are used to analyze user behavior and the structure of websites. The analysis often provides important insights for the OnPage optimization of a website.
Origins
The heat map has been used as a method of visualizing data or information since the 19th century when Paris city planners used different colors to mark the city map in order to illustrate statistical data more clearly.
Today, heat maps are used in many different fields. These include weather maps, energy consultation, analyses of sports games, and in particular, online marketing for website analysis.
Structure
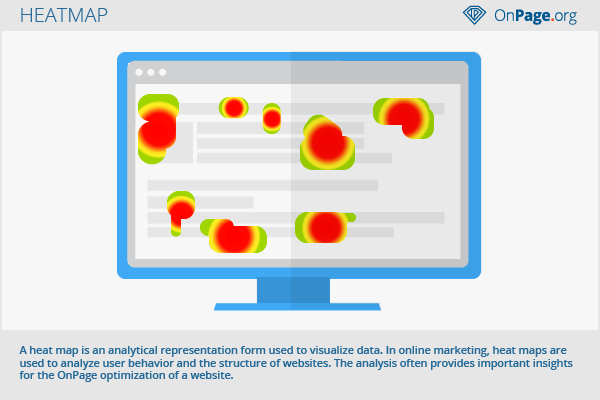
A heat map uses different colors that are typically associated with temperatures. Thus, the classical heat map contains the colors red (for very hot), orange (for moderately hot), yellow (for warm), green (for cool), blue (for cold). Gradations between the various colors make up the transitions.
For instance, in the context of an eye tracking analysis, dark-red fields could be used to mean that subjects focused their gaze at that particular part of the website for quite long. Dark blue areas could indicate areas that were not viewed by the test persons. In most cases, a so-called ‘f-shaped pattern’ is provided, which is considered a standard model in the field of eye tracking.
The following page uses keyboard inputs to provide a clear illustration of how heat maps are created: www.patrick-wied.at/projects/heatmap-keyboard/.
Uses in online marketing
Heat maps are interesting analysis tools for SEOs and marketing strategists. For example, SEOs can use heat maps to localize important areas of a website in order to place the relevant contents there and hence achieve a higher CTR. At the same time, the heat map also helps improve the usability of a website. It can also provide web designers with clues for the design of a website. Similarly, SEOs can use heat maps to better plan the placement of certain page elements.
Among the things that can be visualized using heat maps are:
- Clicks by users on the web offer
- Mouse movements on the website
- Eye movements (here, the heat map is often the result of eye tracking studies)